|
Abstract
Introduction: The study of mortality in
India during the first part of the twentieth century
forms a very important and interesting study.
It is very significant to note that India's population
growth in those years (1901-1951) was governed
not by the fluctuations in the birth rate but
by the wide variations in the death rate. This
kind of study is therefore increasingly being
necessary to examine the past and future population
trends of India.
Objective: The aim of the present study
is to construct a sex wise generation life table
of India and to assert the advantage of generation
life expectancy over period life expectancy. Further,
the effects of different birth cohorts on distribution
of age at death for male and female populations
of India are also examined.
Data and Methodology: The data used in
this study are secondary in nature and put with
fitted arguments.
Results and Conclusion: The construction
of a different generation life table of India
shows the higher value of generation life expectancy
over period life expectancy and helps to recognize
that different birth cohorts of India have different
distributions of age at death. This can be important
for policy makers to tackle the health problems
of different cohorts. It is further expected that
the construction of generation life table would
open up newer areas of studying the mortality
pattern of a country.
Key words: Generation Life Table, India,
Generation Life Expectancy, Period Life Expectancy,
Trend of Mortality.
|
- - - - - - - - - - - - - - - - - - -
- - - - - - - - - - - - - - - - - - - - - - - -
Introduction
The study of mortality in India during the first part
of the twentieth century forms a very important and
interesting study. It is very significant to note that
India's population growth in those years i. e. from
1901 to 1951 was governed not by the fluctuations in
the birth rate but by the wide variations in the death
rate. Thus death rate, not birth rate determines the
population trend in India. In those earliest years of
the twentieth century, the population was constant or
declined as a result of great catastrophe like famine,
epidemic, war or at times, a combination of all these.
Even though at some point of time the Indian populace
was exempted from the aforementioned calamities, it
was however constantly being the prey of poor diet which
very significantly determined the mortality patterns
of the country. The change in population is also negligibly
influenced by impact of emigration. The study of mortality
is increasingly being necessary to examine the past
and future population trends of India. (Davis, K., 1961).
This kind of work requires a long time series of data
which subsequently enables one to trace the demographic
history of a birth cohort, that is, the group of persons
born in a given year. ( Bourbeau, et.al. ,2004). Here
comes the importance of construction of generation life
tables.
Life tables are one of such vital statistical models
through which transition pattern of mortality can be
explained. A life table has been universally regarded
as a concise way of showing the ability of a member
of a particular populace existing or disappearing at
a particular age. Life tables do not require standard
population for comparing mortality like other measures
of mortality. The levels and trends in mortality depict
the change in the quality of life of a population. The
community health employees, researchers, planners and
many more from other allied disciplines utilize life
table notion and method in their study. (Kintner, 2004).
Stating the importance of life tables Coale and Demeny
(1966) opine "Life tables provide a succinct description
of what is the most prominent aspect of the state of
human mortality; they show the varying chances of dying
as a function of age."
Life table can be categorized into two types according
to the reference year - period or current life table
and generation or cohort life table. The period life
table demonstrates the collective mortality experience
by age of the people living in an area. It describes
the mortality pattern prevailing in a particular short
period such as one or three years. The second type of
life table i.e. the generation life table consists of
mortality rates experienced by a particular birth cohort,
in which the age specific death rates of that cohort
from their birth through each consecutive age in successive
calendar years are used. This kind of life table requires
data for a long period, at least for 100 years. This
requirement of data for a longer period put hurdles
in constructing generation life tables. Hence one generally
prefers construction of period life table instead of
generation life tables. However, generation life tables
have their own share of significance in projecting actual
mortality transition. Generation life table is useful
for projections of mortality, for study of mortality
trends, and for the measurement of fertility and re-productivity
(Kintner, 2004). Hence, more precisely, the generation
life tables can be used to compute generation reproduction
rates, to study life expectancy historically, to project
mortality, and to make estimates of orphanhood (Gregory,
1965). In this way, generation life tables help to study
the mortality trends in a population more specifically
since they are based on the different combinations of
age specific death rates.
Dublin and Spiegelman (1941), Dublin, Lotka and Spiegelman
(1949), Spiegelman (1957) and others study generation
life tables with great results. A number of countries
viz. Germany (Bomsdorf, 1993), England and Wales (Case,
1962), Australia (Lancaster,1959; Young,1969), Belgium
(Veys,1981), France (Delaporte, 1941; Vallin, 1973),
the Netherlands (Tas, 1991; Van Poppel, 1996), Sweden
(Schoen and Urton 1979; Bolander,1970), the United States
(Jacobson, 1964), Thailand (Prasartkul and Rakchanyaban,
2002), Canada and Quebec (Bourbeau.et.al, 2004) construct
generation life tables. However in India due to a dearth
of reliable data on mortality, period life tables are
usually preferred instead of generation life tables.
However, the period life table has certain problems
in reflecting proper mortality pattern. This method
understates the mortality status as it believes in a
unitary set of health conditions. The generation life
table, on the other hand, could represent the development
of life expectancy of real cohorts since it believes
in changing mortality status over the years. Willets
(1999), (2004), Richards and Jones (2004), Richards
et al. (2006) and many others also discuss the importance
of birth cohorts for studying the pace of mortality.
The aforesaid discussion prompts one to construct sex-wise
generation life table for India. This will further help
one to examine the influence of different birth cohorts
on distribution of age at death.
Objectives
The objectives of this paper are:
1. to construct sex wise generation life table
of India for 1901 to 1951, for birth cohorts 10 years
apart.
2. to assert the advantage of generation life
expectancy over period life expectancy by computing
the magnitude of the gap between the two life expectancies.
3. to examine the effects of different birth
cohorts on distribution of age at death for male and
female population of India.
Data and Methodology
It has already been mentioned that the key focus of
this work is to trace the mortality trend of India for
the period 1901 to 1951 by constructing a generation
life table. Justifications for use of generation life
table has partly been offered in the introduction and
widely been discussed throughout this paper. Though
it is possible to construct generation life table for
any birth cohort, this study earmarked the period from
1901 to 1951 with specific reasons. It is considered
that the pre twentieth century data for India are seemingly
hazy and unreliable and beyond 1951, data become too
dependent on projections.
The data used in this study are secondary and the unavailability
of reliable data for such a long period of time justifies
the use of different sources of secondary data for constructing
the generation life tables. Murray et.al (2003) has
supported the use of different sources of data to estimate
mortality in countries like India, China and Brazil
where different sources including surveillance systems,
vital registration and surveys are used. Here we do
not go for smoothing of the data since in this study
of generation life table; the emphasis is to establish
its closeness to the actual data than to remove the
fluctuations if any. (Kintner, 2004). The different
steps required for constructing generation life tables
are discussed in the following:
Computing and estimating life expectancies at birth:
The first step in constructing generation life table
is to obtain and estimate the trends of sex wise period
life expectancies at birth eo. In this work eo are obtained
for population of India during the 20th and first half
of the 21st century (1901 to 2051) from the available
data. For instance, the construction of a generation
life table of 1901 requires life expectancy at birth
for 100 years i.e. for 1901,1902, 1906 and then for
every 5 year intervals, 1911,1916 so on up to 2001.
This will provide information for ages 0, 1, 5, 10 ,....
and so on as in the case of abridged life table. The
generation life tables of 1911, 1921, 1931, 1941 and
1951 will follow the similar pattern.
In this work the data on life expectancy at birth for
the male and female population of India is taken from
life tables constructed by Malaker and Roy (1990), reports
published by the office of the Registrar General of
India (Sample Registration System reports: 1989-93,
1994-98 and 1999-2003), CBHI (Central Bureau of Health
Intelligence, 2005) and life expectancy at birth projections
made by Mahmood and Kundu (2006). The generation life
tables of this study are based on a set of life expectancy
at birth available for the periods covered as shown
below:
Period 1901-1971:
The life expectancy at birth from 1901, 1911 to 1971,
i.e. for every 10 year intervals were obtained from
CBHI (Central Bureau of Health Intelligence, 2005).
Period 1902-1952 and for the year 1980:
The life expectancy at birth for the years 1902, 1912,
1922, 1932, 1942, 1952 and 1980 were estimated from
the available period life tables by assuming a uniform
annual increment or decrement of expectation of life
at birth. The Registrar General of India used to estimate
life expectancy at birth using Sample Registration System
(SRS) data for some states of India. These estimates
are derived from the clubbed data for a period of five
years of Age Specific Mortality Rate and published in
SRS abridged life tables. The estimates for the period
1998-02 may be referred to the mid period 2000. This
is illustrated as follows: If life expectancy at birth
increases by 3.8 years during 1991-2000, then it gains
at about 0.38 years annually. (SRS based on abridged
life table 2002-06). This incites us to assume that
life expectancy at birth increases/decreases uniformly
annually.
Period 1906-1986:
The mid period life expectancy i.e. for 1906, 1916 to
1986, i.e. for every 10 year interval, was not available
in CBHI and hence taken from life tables constructed
by Malaker and Roy (1990). Malaker and Roy reconstructed
life tables for India from 1901-11 to 1971-81 and projected
for 1981-91 and 1991-2001. Further the mortality pattern
observed in the life tables of Malaker and Roy (1990)
is similar to the sample registration system and thereby
validates the use of the life tables of Malaker and
Roy in this study.
Period 1991-2001:
The life expectancy at birth for the years 1991, 1996
and 2001 were obtained directly from period life tables
of 1989-93, 1994-98 and 1999-2003 constructed by Register
General of India, using Sample Registration System.
(SRS Analytical Studies, Report No. 1 of 1996, report
No.3 of 2003 and report No.1 of 2006).
Period 2006-2051:
The life expectancy at birth from 2006 to 2051 was taken
from the projections made by Mahmood and Kundu (2006).
The rationale behind the use of this projection is that
it projects population of India by using component method
of projection, similar to Mari Bhat (2001) who projects
population of India around the year 2025 by using the
same method. The base year in the former case is provided
by the census of India 2001 whereas Mari Bhat considers
it to be 2000, on the basis of the provisional results
of the 2001 census. The life expectancy at birth of
the male and female population of India for the year
2011 is 65.77 and 67.95 years respectively according
to the 2011 census. (Office of the Registrar General
and Census Commissioner, 2011), and the corresponding
eo in 2011 estimated by Mahmood and Kundu (2006) are
65.48 and 68.95 respectively. This may provide necessary
justification in support of using this projection for
constructing generation life table. With the help of
the aforementioned sources we have obtained and estimated
the different life expectancies at birth for the male
and female population of India.
The life expectancies as shown in figure 1 represent
the pattern of mortality evolution of population of
India during the 20th and the first half of the 21st
century.
Figure 1: Trend of eo
from 1901-2051, India, males and females
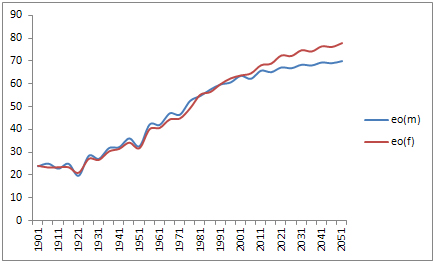
Table 1: Estimated Sex wise Life expectancies at
birth, India, 1901-2051
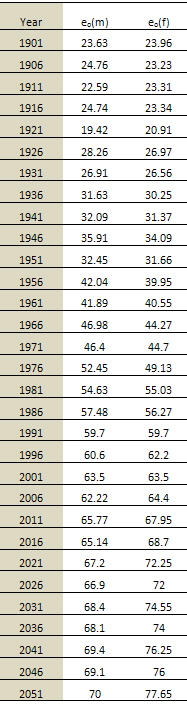
The above table and figures track the general trend
of mortality by computing expectation of life at birth
for the males and females of India from 1901 to 2051.
It is observed that eo ranges between 19 and 78 years
during the 20th and first half of the 21st century.
In the beginning of the twentieth century males and
females of India were subjected to excess mortality
due to prevalence of epidemics, floods, famines and
war or a blending of all these. The first half of the
twentieth century witnessed the influenza endemic of
1918 which increased the annual death rate to 63 per
thousand. But after this calamity, death rate was never
too high and it started declining gradually. The infant
mortality rate was also high in 1918. It was 267 per
thousand life births and a gradual decline thereafter.
Though such decline in infant mortality rate is not
parallel to the general mortality rate; the fall in
the infant mortality contributed a major share to the
reduction in general mortality. (Davis,K. 1951). Further,
data from Sample Registration System indicates that
Crude Death Rate of India declined from 14.9 in 1971
to 7.6 in 2005. The infant mortality rate of India also
declined from 115 per thousand live births in 1961 to
53 in 2008. (Sample Registration System, 2001). This
transformation of mortality over the years influenced
the expectation of life at birth. The present study
also observes that between 1901 and 2051, female birth
cohorts' life expectancy at birth is more than three
times in India rising from 24 years to 78 years. However
the gains for males were smaller than the females, with
life expectancy at birth of males rising only from 24
years to 70 years between the same cohorts. The present
and future females of India thus would have higher life
expectancy at birth than the males. Bourbeau et al (2004)
too observe higher life expectancies at birth among
females of Canada and Quebec than the males. From figure
1 it is seen that the gap between life expectancy at
birth for the two sexes remained almost negligible in
the twentieth century. However the 21st century female
cohorts have considerably improved their probability
of survival compared to those of the male cohorts. The
gap between life expectancy at birth for the two sexes
of India rose to 1 year for the 1911 cohort to 8 years
for the 2051 cohort. An Indian female in the 2051 cohort
would, therefore, expect to live 8 years longer than
her male counterpart. Bourbeau et al (2004) also find
that the gap between life expectancy at birth for the
two sexes rose from 5 years for the 1901 cohort to 8
years for the 1941 cohort for Canada.
Derivation of nqx
from the above estimated eo:
These computed eo
are now used to obtain the probability of death by age
(nqx).
In India period life tables are not available for every
year of this study. Hence model life tables are used.
The model life tables are also used by the United Nations
population Division and the World Bank from their estimated
and extrapolated life expectancies. Out of the four
Coale and Demeny regional model life able, we use here
West model life table. The table covers countries of
Western Europe and the non-European population. This
model is the representative of the general mortality
pattern since it is derived from the largest and broadest
variety of cases. In general, the West families of the
Coale- Demeny model produce better overall fit to the
data especially at the younger ages, 0-15 years. (Coale
and Demeny,1966). And in our country, the age group
is most unpredictable. In 1982 the United Nations published
a set of model life tables for developing countries.
But in this study the life expectancy at birth does
not match with any of the five regions prepared by the
United Nations. Hence it catalyses this work to use
West model life table in studying mortality trends.
The following formula as suggested by Keyfitz for which
period life table is unavailable is used for obtaining
a comparable set of model life tables for each sex with
the same level of life expectancy at birth as that of
the individual states. This formula is also discussed
by Kohli (1977). Also this notion is partially used
by Andreev, E et al (1985) in obtaining distribution
of mean life expectancy of 100,000 randomly chosen pairs
on the 81 points with a maximum
difference in eo of 3 years. Mahmood
and Kundu (2006) also observed that the figure of eo
is very helpful for selecting suitable model life table
for a country for which a reliable life table is not
available.
The formula to obtain the probability of death is discussed
as follows:
The weight W is obtained as

Where i stands for expectation of life at birth of an
individual state and eo and eo'
are the upper and lower limits of the expectation of
life at birth of the West model life table.
The new set of qx'' values is
obtained by

qx and qx' are the observed values
for the above expectation of life at birth of the model
life table.
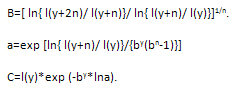
The last age used in these mortality data is 100. Hence
we apply mortality law l(x) = C* ab
to extrapolate survivors in a life table beyond the
last age as discussed by Preston et al (2001). Parameters
C, a and b can be estimated from the last three values
of the life table survival function, l(y), l(y+n) and
l(y+2n).(Horiuchi and Coale,1982). We have
Now
nqx is obtained
from the above extrapolated lx
values by using nqx
= ndx/lx
The nqx
for the years 1921 and 1941 are obtained directly from
the life tables constructed by Davis (1951). In his
study life tables are constructed for males and females
of India for 1911-21 and 1931-41. The nqx
for the years 1991, 1996 and 2001 were obtained directly
from the period life tables of 1989-93, 1994-98 and
1999-2003 as published by the office of the Registrar
General of India. (SRS Analytical Studies, Report No.
1 of 1996, report No.3 of 2003 and report No.1 of 2006).
Arrangement of nqx
by age and calendar years:
These nqx
are to be arranged by age and calendar years to represent
the mortality schedule at corresponding ages of each
birth cohort. Figure 2 explains the procedure of transformation
of nqx presenting
the nqx
of 1901 generation life table. The examples are as follows:
1q0 of the
cohort born in 1901 is the 1q0
in the 1901 period life table,
4q1 of the
cohort born in 1901 is the 4q1
in the 1902 period life table,
5q5 of the
cohort born in 1901 is the 5q5
in the 1906 period life table,
5q90 of
the cohort born in 1901 is the 5q90
in the 1991 period life table,
and 5q100
of the cohort born in1901 is equal 1.
Figure 2: Transformation of nqx
from period to cohort life tables
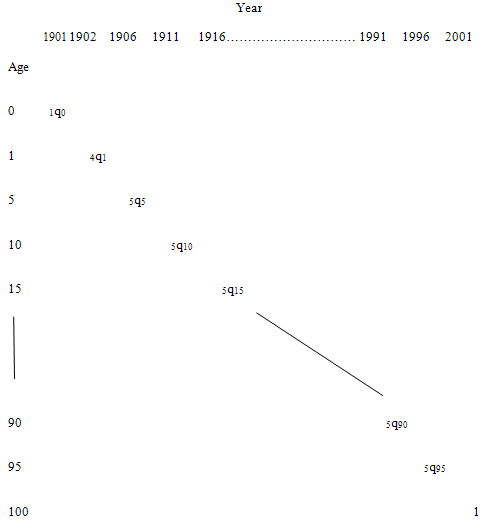
Figure 3: Generation probabilities of death (nqx)
across different birth cohorts of males of India
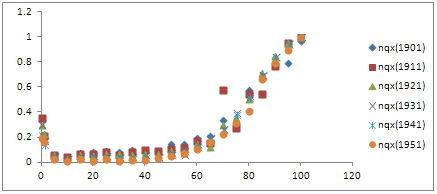
Figure 4: Generation probabilities of death (nqx)
across different birth cohorts of females of India

Figures 3 and 4 (as shown above) represent the generation
probabilities of death by age, sex and birth cohort.
In general, the probability of dying for all ages has
fallen for both males and females since the 1901 cohort.
However, a generalized excess mortality among males
and females are observed for the 1911 cohort. This decade
1911-21 recorded the highest decade mortality rate due
to the ravages of the 1918-19 influenza epidemic (Davis,
K. ,1951). In 1918 influenza alone claimed 12 million
lives in India. Further plague, smallpox, cholera, etc.
also catalyzed the high mortality during this period.
The severe droughts in 1911, 1913, 1915, 1918 and 1920
also increased the death toll. The First World War (1914-18)
also claimed the lives of thousands of Indian soldiers.
However after 1921, improvement in health and sanitation
conditions controlled occurrences of epidemics to some
extent. These resulted in declining death rate. The
diminishing trends of death rate were also achieved
as a result of improvement in transportation which subsequently
facilitates distribution of food during drought and
flood across the country (Census of India 1911 and 1921).
The shape of the curve (in figures 3 and 4) representing
the probability of dying at different ages has changed
little over the generations for both males and females.
The probability curve for the 1911 male cohort shows
up a bump at age 70 whereas there was no such bump for
female cohort, probably death was not sufficiently significant
among female cohorts to change the shape of the curve.
Calculation of other columns
of the life table:
Other columns of the life table can be described as
follows:
Year: 1901-2001.
Age: 0-100.
ndx : Number
of deaths in the cohort between ages x and x+n.
ndx = nqx
* lx
lx : Number of survivors to age
x in the cohort.
l0=100000.
nLx : is
the number of person years lived in the cohort between
ages x and x+n.
According to Reed and Merrell
Lx may be obtained from the following equations for
ages under 10.
L0=0.276lo+0.724l1
4L1=0.034l0+1.184l1+2.782l5
5L5=-0.003l0+2.242l5+2.761l10
Greville (1943) observed that method given by Reed and
Merrell is a particular case and suggested the following
formula when n is equal
nLx =n/2(lx+lx+n)+n/24(ndx+n-ndx-n)
For last age 100, L100=l100 (log10l100).
Tx : Person years lived above age x.
Tx= nLx
nLx
ex : Expectation of life at age
x.
ex = Tx/
lx.
This lead to construction of sex wise generation life
tables of India for the years 1901, 1911 to 1951, every
10 years apart as depicted in tables 2 to 4.
Calculation of gap:
Gap is computed by
Gap=Cohort life expectancy at birth - period life expectancy
at birth (Goldstein and Wachter, 2006). This gap will
reflect the change in mortality pattern over time by
studying the differences between period and cohort life
expectancy at birth across cohorts as shown in Table
5.
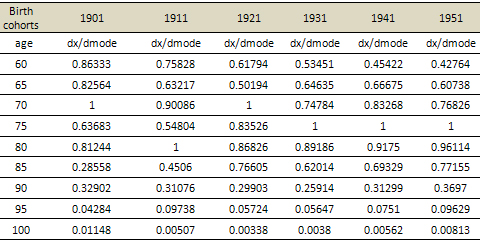
Distribution of age
at death for 60+
or aged to study the effects of different cohorts:
Distribution of age at death=db,x/db,mode
(Richards, 2008)
db,x and db,mode
are the number of deaths at age x and number of deaths
at the modal age at death for birth cohort b respectively.
This ratio will take the peak value one at the modal
age at death i.e. at age having maximum number of deaths
as portrayed in Tables 6 and 7.
Results and Conclusions
The construction of generation life table informs about
the general mortality trends prevailing among male and
female populations of India. Tables 2 to 4 represent
the generation life table for birth cohort 1901 to 1951
i. e. cohorts born every 10 years of intervals for male
and female population of India. These tables help in
studying the mortality transition of people residing
in this part of the world.
The generation life expectancies are calculated by allowing
changes in mortality rates in coming years and are hence
considered as the more appropriate measure to know about
a person's expectation of life. (Kintner, 2004). Table
5 depicts the variation between period and cohort life
expectancy at birth by computing gaps. In India gaps
rise from about 1 year in 1901 to 12 years in 1951 among
its male members. Its female counterpart's gap is slightly
less than one year in 1901 to about 14 years in 1951.
Thus we may observe that the variation between period
and cohort life expectancies has lengthened over time
and it may increase further for both of its male and
female populations of India. Prasartkul and Rakchanyaban
(2002) also observed such a kind of gap among the male
and female population of Thailand. The generation life
table for the cohort of U.S females born in 1900 also
added nearly 10 years to its life expectation at birth
of 58.3 years in contrast to the expectation of life
at birth of period life table of 49 years (Bell et al.,
1992). The cohort life expectancy at birth is greater
than its corresponding period life table since mortality
decreases across the years. The gaps as computed in
columns 4 and 7 of table 5 are the bonus years received
by the cohort from taking advantage of future mortality
improvement. From the same table we may observe that
the period life expectancy at birth in 1941 and 1951
is 32 and 31 years for males and females respectively.
This is the same as generation life expectancy at birth
in 1931. Hence there is a past cohort with the same
summary measure of mortality as given by the period
life table. The plausible reason of this variation may
be that the generation life tables are used to study
the development of mortality and life expectancy of
real cohorts over time. This type of table studies the
mortality improvement for the actual cohort for a long
period of time whereas period life table understate
this improvement. The generation life table considers
the changing intra cohort influence on health whereas
period table considers only the single mortality improvement
pattern and unitary set of health condition (Kintner,
2004). The amount of gap portrays the pace of mortality
improvement across time. In other words the pace of
decline in mortality plays an important role in determining
the magnitude of gap (Goldstein and Wachter 2006). Thus
the generation life table paves new avenues to study
the mortality status of people residing in India.
Tables 6 and 7 show that the birth cohorts of 1901 to
1921 have the modal age at death at age 70 and for birth
cohorts of 1931 onwards the modal age is at age 75 both
for male and female populations of India. Here we observed
a contrast peak value of 1 at age 80 for female birth
cohort of 1911. The peak value 1 at higher ages depicts
that most deaths fall at older ages. This ratio of db,x/db,mode
also indicates the tendency of increasing longevity
by year of birth i.e. fewer premature deaths among the
elderly population of India, with rising birth cohorts.
Richards (2008) also observed that for modern populations
of England and Wales, most deaths fall at older ages,
the peak value will be after age 70 years.
Tables
Different tables have been provided in this section.
Table 2:
Sex Wise Generation Life table of India for 1901 and
1911

Table 3:
Sex Wise Generation Life table of India for 1921 and
1931
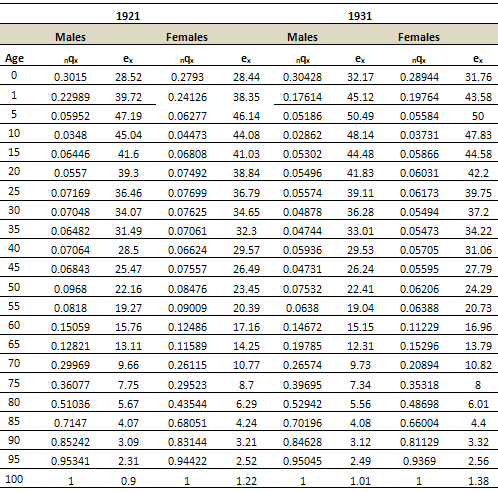
Table 4:
Sex Wise Generation Life table of India for 1941 and
1951

Table 5:
Gap between generation and period life expectancy at
birth

Table 6:
Distribution of deaths by age at different birth cohorts
for male population of India

Table 7:
Distribution of deaths by age at different birth cohorts
for female population of India
References
Andreev, E. Lutz, W. Scherbov, S. (1989) Averaging Life
Expectancy International Institute for Applied Systems
Analysis, W P-89-35.
Bell, F., A. Wade, and Goss, S.(1992) Life tables for
the United States social Security Area 1900-2080. Actuarial
Study, No.107. Office of the Actuary, U.S. Social Security
Administration. SSA Pub. No. 11-11536.
Bhat, M. Indian Demographic Scenario, 2025· (2001)
Population Research Centre, Institute of Economic Growth,
Delhi.
Bolander, A.M. (1970). A study of cohort mortality in
the past hundred years in cohort mortality of Sweden,
three studies describing past, present, and future trends
in mortality, National Central Bureau of Statistics,
Statistical Report, pp. 5-51.
Bomsdorf, E., (1993). Future Developments in Mortality
and Life Expectancy among Birth Cohorts of 1903-1993,
Germany, in Zeitschrift fur Bevolkerungswissenschaft,
Vol.19, No. 1, pp. 93-103.
Case, R.A.M. and al. (1962). Chester Beatty Research
Institute Serial Abridged Life Tables: England and Wales,
1841-1960, The Chester Beatty Research Insitute, London.
Census of India 1911, 1921 2001, 2011, RGI, GOI, http://www.censusindia.gov.in/2011-
prov-results-paper1-india.html.
Central Bureau of Health Intelligence, (CBHI), (2005)
National Health Profile, Govt. of India.
Coale, A. J. and Demeny, P. (1966), Regional Model Life
Tables and Stable Populations, Princeton: Princeton
University Press.
Davis, Kingsley: (1951).The Population of India and
Pakistan, Princeton : Princeton University Press.
Delaporte, P. (1941). "Évolution de la mortalité
en Europe depuis les origines des statistiques de l'état
civil", Étude démographique No. 2,
Paris, Imprimerie nationale, 156 pages.
Dublin L.I., and Spiegelman, M (1941). "Current
Versus Generation Life Tables", Human Biology,13:439-458.
Dublin L.I., Lotka, A.J. and Spiegelman, M (1949). Length
of Life. Rev. ed. New York: Ronald Press.
Goldstein, J.R. and Wachter, K.W. (2006), Gaps and Lags:
Relationships between Period and Cohort Life Expectancy,
Population Studies, March 2006.
Gregory, I. (1965)." Retrospective Estimates of
Orphanhood from Generation Life Tables." Milbank
Memorial Fund Quarterly 43(3):323-348.
Greville, T.N.E. (1943). "Short Methods of Constructing
Abridged Life Tables", The Record of the American
Institute of Actuaries. Col. XXXII, Part 1, No. 65 (June).
Horiuchi, S and Coale, A.J. (1982)." A Simple Equation
for Estimating the Expectation of Life at Old Ages,"
Population Studies,36(2):317-26.
Jacobson, P.H.(1964). "Cohort Survival for Generations
Since 1840." Milbank Memorial Fund Quarterly 42(3):36-51.
Keyfitz, N, A Note on Model Life Tables,(Mimeographed),
as cited by Kohli, K.L. (1977) Mortality in India, a
Statewise Study, Sterling Publishers (Pvt.) Ltd. Page,
98.
Kintner, H.J. (2004). The Life Table. In: Siegel, J.S.
and Swanson, D.A. (eds.). The methods and materials
of demography, 2nd edition. San Diego: Elsevier, Academic
Press: 301-340.
Kohli, K.L. (1977) Mortality in India, a Statewise Study,
Sterling Publishers (Pvt.) Ltd.
Lancaster, H.O. (1959). "Generation Life Tables
for Australia", Australian Journal of Statistics,
No. 1.
Mahmood, A and Kundu, A (2006): "Demographic Projections
for India 2006-2051: Regional variations". Draft
prepared for the IWMI-CPWF project on Strategic Analysis
of National River Linking Project of India.
Malaker, C.R. and Roy, S. Guha. (1990), Reconstruction
of Indian Life Tables for 1901-1981 and Projections
for 1981-2001, Sankhya: the Indian Journal of Statistics
volume 52, series b, pt. 3, pp. 271-286.
Murray CJL, Ferguson BD, Lopez, A. D. Guillot M, Salomon
JA, Ahmad OB,(2003) Modified logit life table system:
principles, empirical validation, and application, Population
Studies, Vol. 57, No. 2, pp. 165-182.
Pearl, R. and Reed. L.J. (1920), On the rate of growth
of the population of the United States since 1790 and
its mathematical representation, Proceedings of the
National Academy of Sciences 6, 275-288
Prasartkul ,P and Rakchanyaban, U; (2002) Estimated
Generation Life Tables for Thailand of Five-Year Birth
Cohorts:1900-2000. IPSR Publication No.261.
Preston, S.H., Heuveline, P., and Guillot, M. (2001)
Demography, Measuring and Modeling population Processes.
Blackwell publishers Ltd,Oxford,UK.
Richards, S. J. and Jones, G. L. (2004) Financial Aspects
of Longevity Risk. London: Staple Inn Actuarial Society.
Richards, S. J., (2008): Detecting year-of-birth mortality
patterns with limited data, J. R. Statist. Soc. A, 171,
Part 1, pp. 279-298.
Richards, S. J., Kirkby, J.G. and Currie, I.D. (2006)
The importance of year of birth in two-dimensional mortality
data. Br. Act. J., 12, 5-61.
Schoen, R. and Urton, W. L. (1979). Marital Status Life
Tables for Sweden, Years1911-1973 and Cohorts Born 1885/89-1940/44,
Urval, Published by the National Central Bureau of Statistics,
Stockholm, No. 10, 272 pages.
SRS based Abridged Life Tables 1989-93, 1994-98 and
1999-2003 SRS Analytical Studies, Report No. 1 of 1996,
SRS Analytical Studies, Report No. 3 of 2003 and SRS
Analytical Studies, Report No. 1 of 2006; Registrar
General, India New Delhi.
SRS based Abridged Life Tables 2002-06 Office of the
Registrar General, India New Delhi.
Sample Registration System (2001): Office of the Registrar
General, India New Delhi.
Tas, R.F.J. (1991). "Cohort Life Tables for the
Netherlands by Age and Sex Derived from Observations
during the Period 1860-1989", Maandstatistiek Van
de Bevolking, Netherlands, Vol. 39, No. 6, pp. 15-26.
United Nations (1982)). Model Life Tables for Developing
Countries. United Nations Publication, Sales No. E.81.X111.7.
Vallin, J. (1973). La mortalité par génération
en France depuis (1899), Paris, PressesUniversitaires
de France, INED, Cahier No. 63, 483 pages.
Van P., Frans, Tabeau, E. and Willekens, F. (1996).
"Trends and Sex Differentials in Dutch Mortality
Since 1850: Insights from a Cohort- and Period-Perspective",
Genus, Vol. LII, No. 3-4, Luglio-December, pp. 107-134.
Veys, D. (1981). "De sterftetafels, transversaal
en longitudinaal, in België", Bevolking en
Gezin, No. 2, pp. 205-227.
Willets, R. C. (1999) Mortality in the Next Millennium,
Staple Inn Actuarial Society, London.
Willets, R. C. (2004) The cohort effect: insights and
explanations. Br. Act. J., 10, 833-877.
Young, C.M. (1969). An Analysis of the Population Growth
and Mortality of Selected Birth Cohorts in Australia,
Ph.D Thesis, Department of Demography, Australian National
University, Canberra.
|